🔗 Official Website
Trends
Pricing Type
Description
PlotGPT: An AI Assistant for Data Visualization
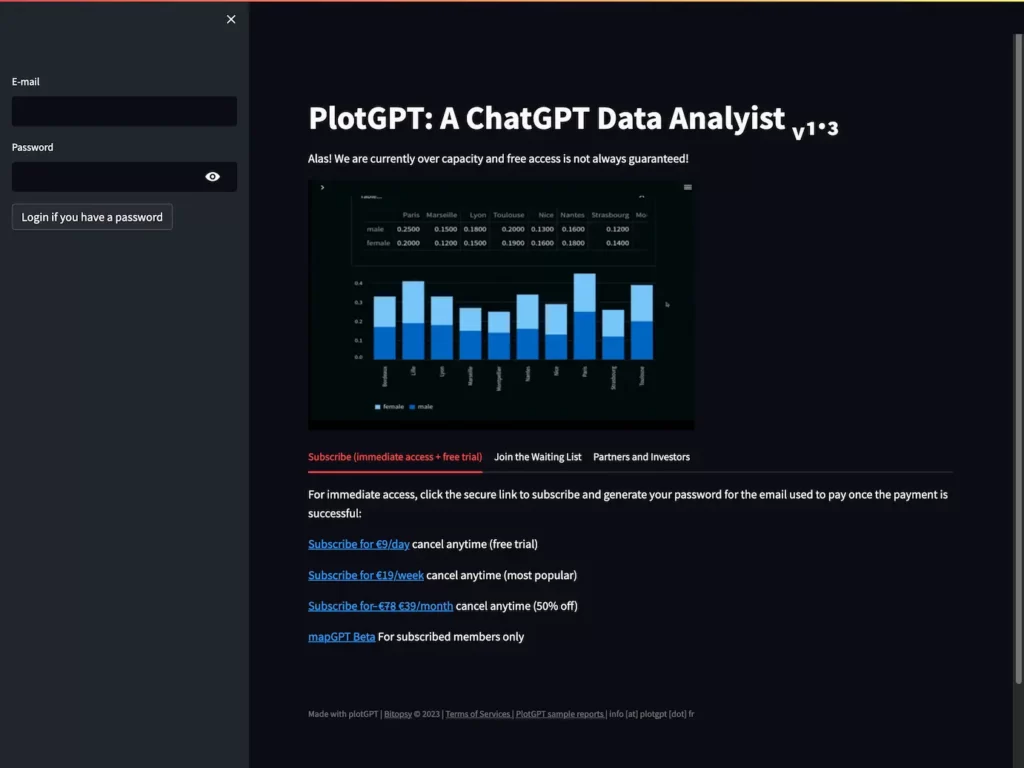
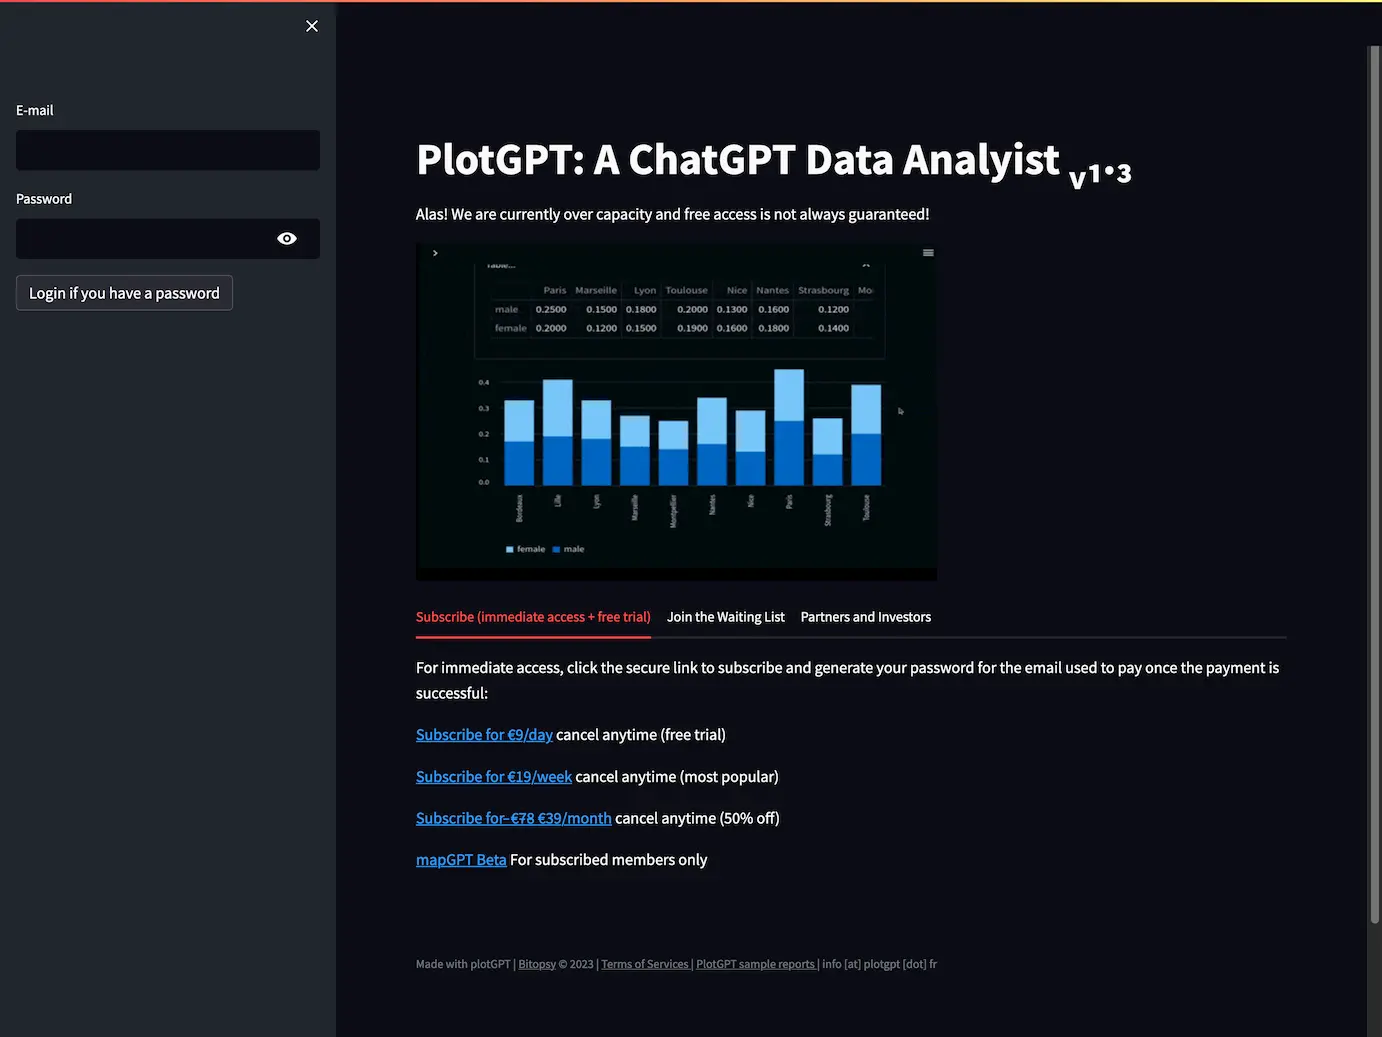
PlotGPT is a versatile AI assistant designed to assist users in creating data visualizations and infographics for various purposes such as academic papers, reports, or presentations. It is built on top of the langchain and openai platforms, making it a powerful tool for visualizing data.
Some key features and insights about PlotGPT include:
- Customizable Data Analysis: PlotGPT offers customizable options for data analysis, allowing users to tailor their analysis to their specific needs. This feature is particularly useful for researchers and professionals who need to explore and interpret data efficiently.
- User-Friendly Data Visualization: PlotGPT provides user-friendly data visualization capabilities, making it accessible even to those without advanced data science skills. This feature can save time and effort when creating visual representations of data.
- Versatile Applications: PlotGPT can be adapted to various use cases, including academic research, business presentations, and more. Its flexibility makes it a valuable tool in different domains.
- Integration with AI Technologies: It leverages AI technologies, making it capable of understanding and generating visualizations based on user prompts. This can streamline the process of creating charts, graphs, and other visual aids.
- Community and Support: PlotGPT has gained attention on platforms like Reddit, where it has been discussed by users interested in AI-driven tools like ChatGPT. It also has a presence on GitHub, where developers can explore its codebase and potentially contribute to its development.
Overall
PlotGPT serves as a valuable assistant for individuals and professionals looking to create data visualizations and infographics with ease and customization options. Its integration with AI technologies and adaptability to different use cases make it a promising tool for data analysis and presentation purposes.
Features and Benefits
- Customizable Data Analysis: PlotGPT offers customizable options for data analysis, allowing users to tailor their analysis to their specific needs. This feature is particularly useful for researchers and professionals who need to explore and interpret data efficiently.
- User-Friendly Data Visualization: PlotGPT provides user-friendly data visualization capabilities, making it accessible even to those without advanced data science skills. This feature can save time and effort when creating visual representations of data.
- Versatile Applications: PlotGPT can be adapted to various use cases, including academic research, business presentations, and more. Its flexibility makes it a valuable tool in different domains.
- Integration with AI Technologies: It leverages AI technologies, making it capable of understanding and generating visualizations based on user prompts. This can streamline the process of creating charts, graphs, and other visual aids.
Open Source
Tags
Compare with other popular AI Tools
Compare with Qlik-Turn your data into AI-driven insights and action
Compare with Piktochart AI : an AI-driven infographic generator
Compare with Julius.AI-AI data analyst
Compare with Visually
Compare with Daily Infographic
Compare with Coupler.io: All-in-one Data Analytics and Automation Platform
Compare with Clay.com-Automate your sales prospecting by combining data from any provider
Compare with Speak AI- Turn your language data into insights, fast and with no code
Compare with Sprig: AI Empowering Product Teams with User Insights


